Understanding 18% Grey
Of all the concepts in photography, 18% grey is probably the one most frequently mentioned and least frequently explained. It appears in camera manuals, in beginner courses, in discussions of metering and exposure — and is almost always presented as a given rather than a principle that was worked out by specific people, in specific historical contexts, for specific reasons. The figure is just… offered. Eighteen percent. Middle grey. That's what the camera meters to. Move along.
This article is not going to move along. It is going to explain what 18% grey actually is, where it came from, why it sits where it does in the tonal scale rather than at the mathematically simpler 50%, what Ansel Adams and Fred Archer built on top of it, how that building remains relevant to every photograph made on a digital sensor today, and — most practically — what it means for the specific situations in which cameras make confidently wrong exposure decisions.
The argument is this: understanding why cameras are calibrated to middle grey, and what middle grey actually means in perceptual terms, is the key to understanding why cameras make the metering decisions they do, why they get those decisions wrong in specific and predictable ways, and how to correct for those mistakes before you press the shutter. It is, in that sense, one of the most practically useful pieces of conceptual knowledge in photography — not because you will ever need to cite the Munsell value scale at a party, but because it tells you, once and for all, why the camera sees the world the way it does.
What 18% Grey Actually Is
Let us start with the number itself, because it is counterintuitive.
18% grey is a tone that reflects precisely 18% of the light falling on it. Pure white — the white of a calibrated white card, not dirty-wall white — reflects approximately 90–96% of incident light depending on the surface. Pure black — the darkest black a photographic print can produce — reflects somewhere around 3–4%. In between lies the full tonal range of photography.
The mathematical midpoint of a 3–96% range would be somewhere around 50%. A surface that reflects 50% of light would be the halfway point in raw physical terms. So why is the photographic "middle grey" at 18% — much closer to the dark end of the scale — rather than at 50%?
The answer is that human vision is not linear. It is logarithmic.
We do not perceive brightness on a simple additive scale, the way a ruler measures length. We perceive it on a proportional scale — each step up in perceived brightness corresponds not to a fixed increase in light but to a fixed ratio of increase. The difference between a candle-lit room and two candles is enormous to our eyes; the difference between a floodlit stadium and a stadium with one extra floodlight is essentially nothing. The physical difference might be identical in absolute terms; the perceptual difference is not.
Because of this, a surface that reflects 50% of light does not look halfway between black and white to a human observer. It looks quite bright — well into the upper portion of the tonal range. The tone that actually reads as perceptually middle — halfway between the darkest black and the lightest white as our visual system experiences them — is approximately 18% reflectance. This is why camera metering systems are calibrated to this value. The camera is not being arbitrary or historically inertial (though history plays a role, as we will see); it is calibrating to the perceptual midpoint of human vision.
A practical note on precision: the figure is sometimes given as 12%, 13%, or 18% depending on the source and the standard being applied. Kodak's grey card is calibrated to 18% reflectance; camera meters are calibrated to an ISO/ANSI luminance standard that corresponds to roughly 12–13% reflectance — about half a stop lower.
The practical difference matters in some controlled professional contexts but rarely in general shooting; when we talk about "middle grey" and "18%", we are talking about the same perceptual target even if the precise calibration numbers differ slightly between a grey card and a camera's metering system. The principle — that cameras aim for the perceptual midtone — is universal.
The Science of Logarithmic Vision
The perceptual phenomenon behind 18% grey was not discovered by photographers. It was described, more formally, by two nineteenth-century German scientists working on the nature of human sensation.
Ernst Weber established in the 1830s and 1840s that the just-noticeable difference between two stimuli — the smallest change you can reliably detect — is not a fixed absolute amount but a fixed proportion of the original stimulus. To notice that a weight has become heavier, you need it to increase by a certain fraction, not a certain number of grams. The fraction stays roughly constant; the absolute amount varies with the starting weight.
Gustav Fechner took Weber's finding and extended it into a broader claim about perception (published in Elemente der Psychophysik, 1860): that perceived intensity increases as the logarithm of physical intensity. Not in proportion to it — as the logarithm of it. This is the Weber-Fechner Law. It applies to brightness, to loudness, to the sensation of weight, and to most other sensory dimensions.
For photography, the implication is direct. If you double the amount of light in a scene — one stop more exposure — the camera sensor records exactly twice as much light. But you do not perceive the scene as twice as bright. You perceive it as approximately one step brighter on a scale that your visual system arranges in logarithmic increments.
This is why the stop scale in photography is logarithmic: each stop doubles or halves the physical light, and in doing so it maps directly to a single perceptual step in brightness. The stops are not arbitrary; they are calibrated to how vision works.
The directly relevant implication: on a scale where perceived brightness steps are equal, the physical midpoint — the tone that looks middle to a human eye — is not 50% reflectance. It is the geometric mean of the range. For a photographic tonal range running from roughly 3% to 90% reflectance, the geometric mean is approximately 16–18%.
Middle grey, mathematically derived from the logarithmic nature of vision, lands very close to the 18% figure that photographic practice settled on. This convergence is not coincidental.
The Munsell Value Scale
Albert Henry Munsell, an American artist and art teacher, set out in the early 1900s to construct a rational, perceptually uniform colour system — one in which equal steps in the notation corresponded to equal perceptual steps rather than equal physical measurements. His work, published as A Color Notation (1905) and refined over subsequent decades, organised colours by hue, value (lightness), and chroma (saturation).
The value scale — his neutral grey scale — ran from 0 (pure black) to 10 (pure white), with Value 5 in the middle. The key point: the steps on this scale were arranged so that they looked equal to a human observer, not so that they were equal in reflectance. When Munsell's son, Alexander Ector Orr Munsell, published a rigorous recalibration of the system in 1933 (with Sloan and Godlove), the mid-tone — Munsell Value 5 — was found to correspond to approximately 18% reflectance.
This is, to be precise about historical causation, where the 18% figure comes from. Not from Kodak, and not originally from Adams — from a series of perceptual experiments on neutral grey scales that found 18% to be the physical reflectance that looks middle to human observers.
Kodak adopted this standard for their grey card; Adams adopted it for Zone V; camera manufacturers adopted it (approximately) for their metering systems. All of them were working from the same underlying perceptual fact.
One nuance worth noting: Munsell's original N5 was approximately 25% reflectance; it was the 1933 recalibration that landed at 18%. More recent perceptual standards — CIELAB (1976), sRGB (1996) — place their mathematical midpoints at slightly different values (18.42% and 21.40% respectively). The photographic industry standardised on 18% before these later refinements; the differences are small and the principle is the same across all of them.
The History of 18% Grey
The story of how 18% grey became a photographic standard begins not with cameras or film but with printing presses — specifically, with halftone printing.
Halftone printing, which became commercially viable in the 1880s, reproduces continuous tones (photographs, paintings, the graduated shading of a face) by converting them into a grid of dots. The dots are all the same colour — black ink on white paper — but their size varies: large dots produce dark areas, small dots produce light areas, and the eye at reading distance averages the dots and ink into a perception of continuous tone. A 50% dot coverage — equal areas of black ink and white paper — does not look "middle grey" to a human eye, because the white paper is far more reflective than the black ink and the visual system weights the two non-linearly.
Ink press operators needed a physical reference for what middle grey actually looked like in print, independent of the dot calculation. That reference was a card calibrated to approximately 18% reflectance.
So 18% grey predates photography. It was a graphic arts and printing standard — a physical reference for the perceptual middle of the tonal scale — before the first photographic metering system existed.
Kodak's Grey Card
Around the 1930s, when the first reliable photoelectric light meters became available (the Weston meter in 1932, the General Electric meter in 1935), Kodak formalised the 18% grey card as a photographic exposure tool. The Kodak Grey Card — catalogue number R-27, an 8×10" card neutral grey on one side and white on the other, calibrated to reflect exactly 18% of incident light — became a standard reference in professional and serious amateur photography for decades. Photographers used it to calibrate exposure by metering directly from the card placed in the same light as the subject, thereby obtaining a correct exposure reading independent of the subject's own reflectance.
Kodak also established, in their accompanying instructions, a useful nuance that is often overlooked: when metering from the card in front-lit sunlight, they recommended opening up half a stop from the card reading. This was because their grey card (18% reflectance) is slightly lighter than the scene average that camera meters are calibrated to (approximately 12–13% reflectance under ANSI standards). The half-stop correction is the difference. Whether or not you use that correction in practice depends on your camera and your workflow; what matters is that the grey card's value lies in its known reflectance, not in its perfect agreement with every metering standard.
Ansel Adams & the Zone System
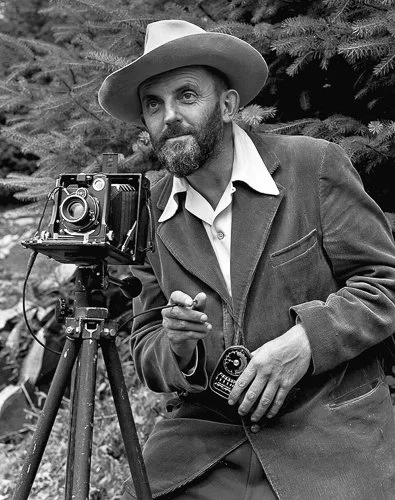
The most systematic, influential, and artistically significant application of the 18% grey principle is the Zone System, developed by Ansel Adams and Fred Archer at the Art Center School in Los Angeles around 1939–40.
Adams himself was emphatic about shared credit: "The Zone System is not an invention of mine; it is a codification of the principles of sensitometry, worked out by Fred Archer and myself at the Art Center School in Los Angeles, around 1939–40." Archer was a portrait photographer and a founding member of the photography department at the Art Center School; his technical knowledge of sensitometry — the study of photographic materials' responses to light — was central to the system's development.
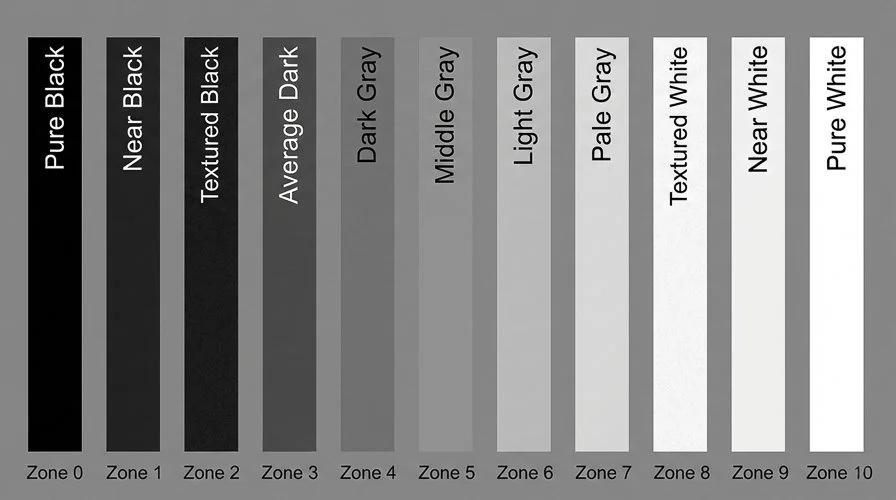
The Zone System divides the tonal range into eleven zones, designated by Roman numerals from 0 (Zone 0, pure black — no detail, no texture) to X (Zone X, pure white — no detail, specular highlight). Zone V is middle grey, 18% reflectance. The zones are one stop apart from each other: Zone VI is one stop lighter than Zone V, Zone IV is one stop darker, and so on.
The fundamental insight, and the one that connects directly to everything this article has been building toward: a camera's meter will render any area it meters as Zone V. This is not a bug in the meter; it is what the meter is calibrated to do. It does not know whether you are pointing it at a white wall or a black cat. It calculates the exposure that would render that luminance value as middle grey — Zone V — and that is the exposure it recommends.
Adams's contribution was to take this mechanical fact and turn it into a creative tool. His method: meter the subject, note what the meter recommends, and then ask — what zone do I want this tone to be? If you want the white wall to appear as a bright but textured white (Zone VIII), give two stops more exposure than the meter indicates. If you want the shadow in a portrait to retain visible detail (Zone III), ensure your shadow reading is two stops below Zone V. You are not overriding the meter; you are using it as a measuring device to place tones where you want them, rather than accepting the camera's default (everything-to-Zone-V) placement.
Adams wrote in The Print: "I have often said that the negative is similar to a musician's score, and the print to the performance of that score. The negative comes to life only when 'performed' as a print." The analogy is exact: the negative captures the tonal information; the print (or, today, the digital post-processing) interprets it according to the photographer's intention. Both stages require deliberate craft. Neither is automatic.
The Zone System & Digital Photography
The Zone System was developed for large-format film, where each negative could be individually developed — you could increase development time ("pushing") to raise contrast and bring out highlight separation, or reduce it ("pulling") to compress the tonal range. That level of individual negative control does not exist in digital photography; a digital capture is a digital capture.
But the Zone System's exposure logic translates directly. When a digital photographer uses spot metering and applies exposure compensation to place a subject tone accurately, they are doing precisely what Adams described. When you pull the Shadows slider up in Lightroom, you are doing in software what Adams achieved by adjusting development time — you are moving tones on the scale. When you shoot ETTR (exposing to the right, keeping the histogram as bright as possible without clipping), you are placing your subject in the upper zones to capture the maximum tonal data and then pulling it down in post — Adams's logic applied to the digital sensor.
The histogram is the modern Zone System. Every time you look at it, you are looking at a tonal distribution across zones — you are seeing, at a glance, where your tones landed.


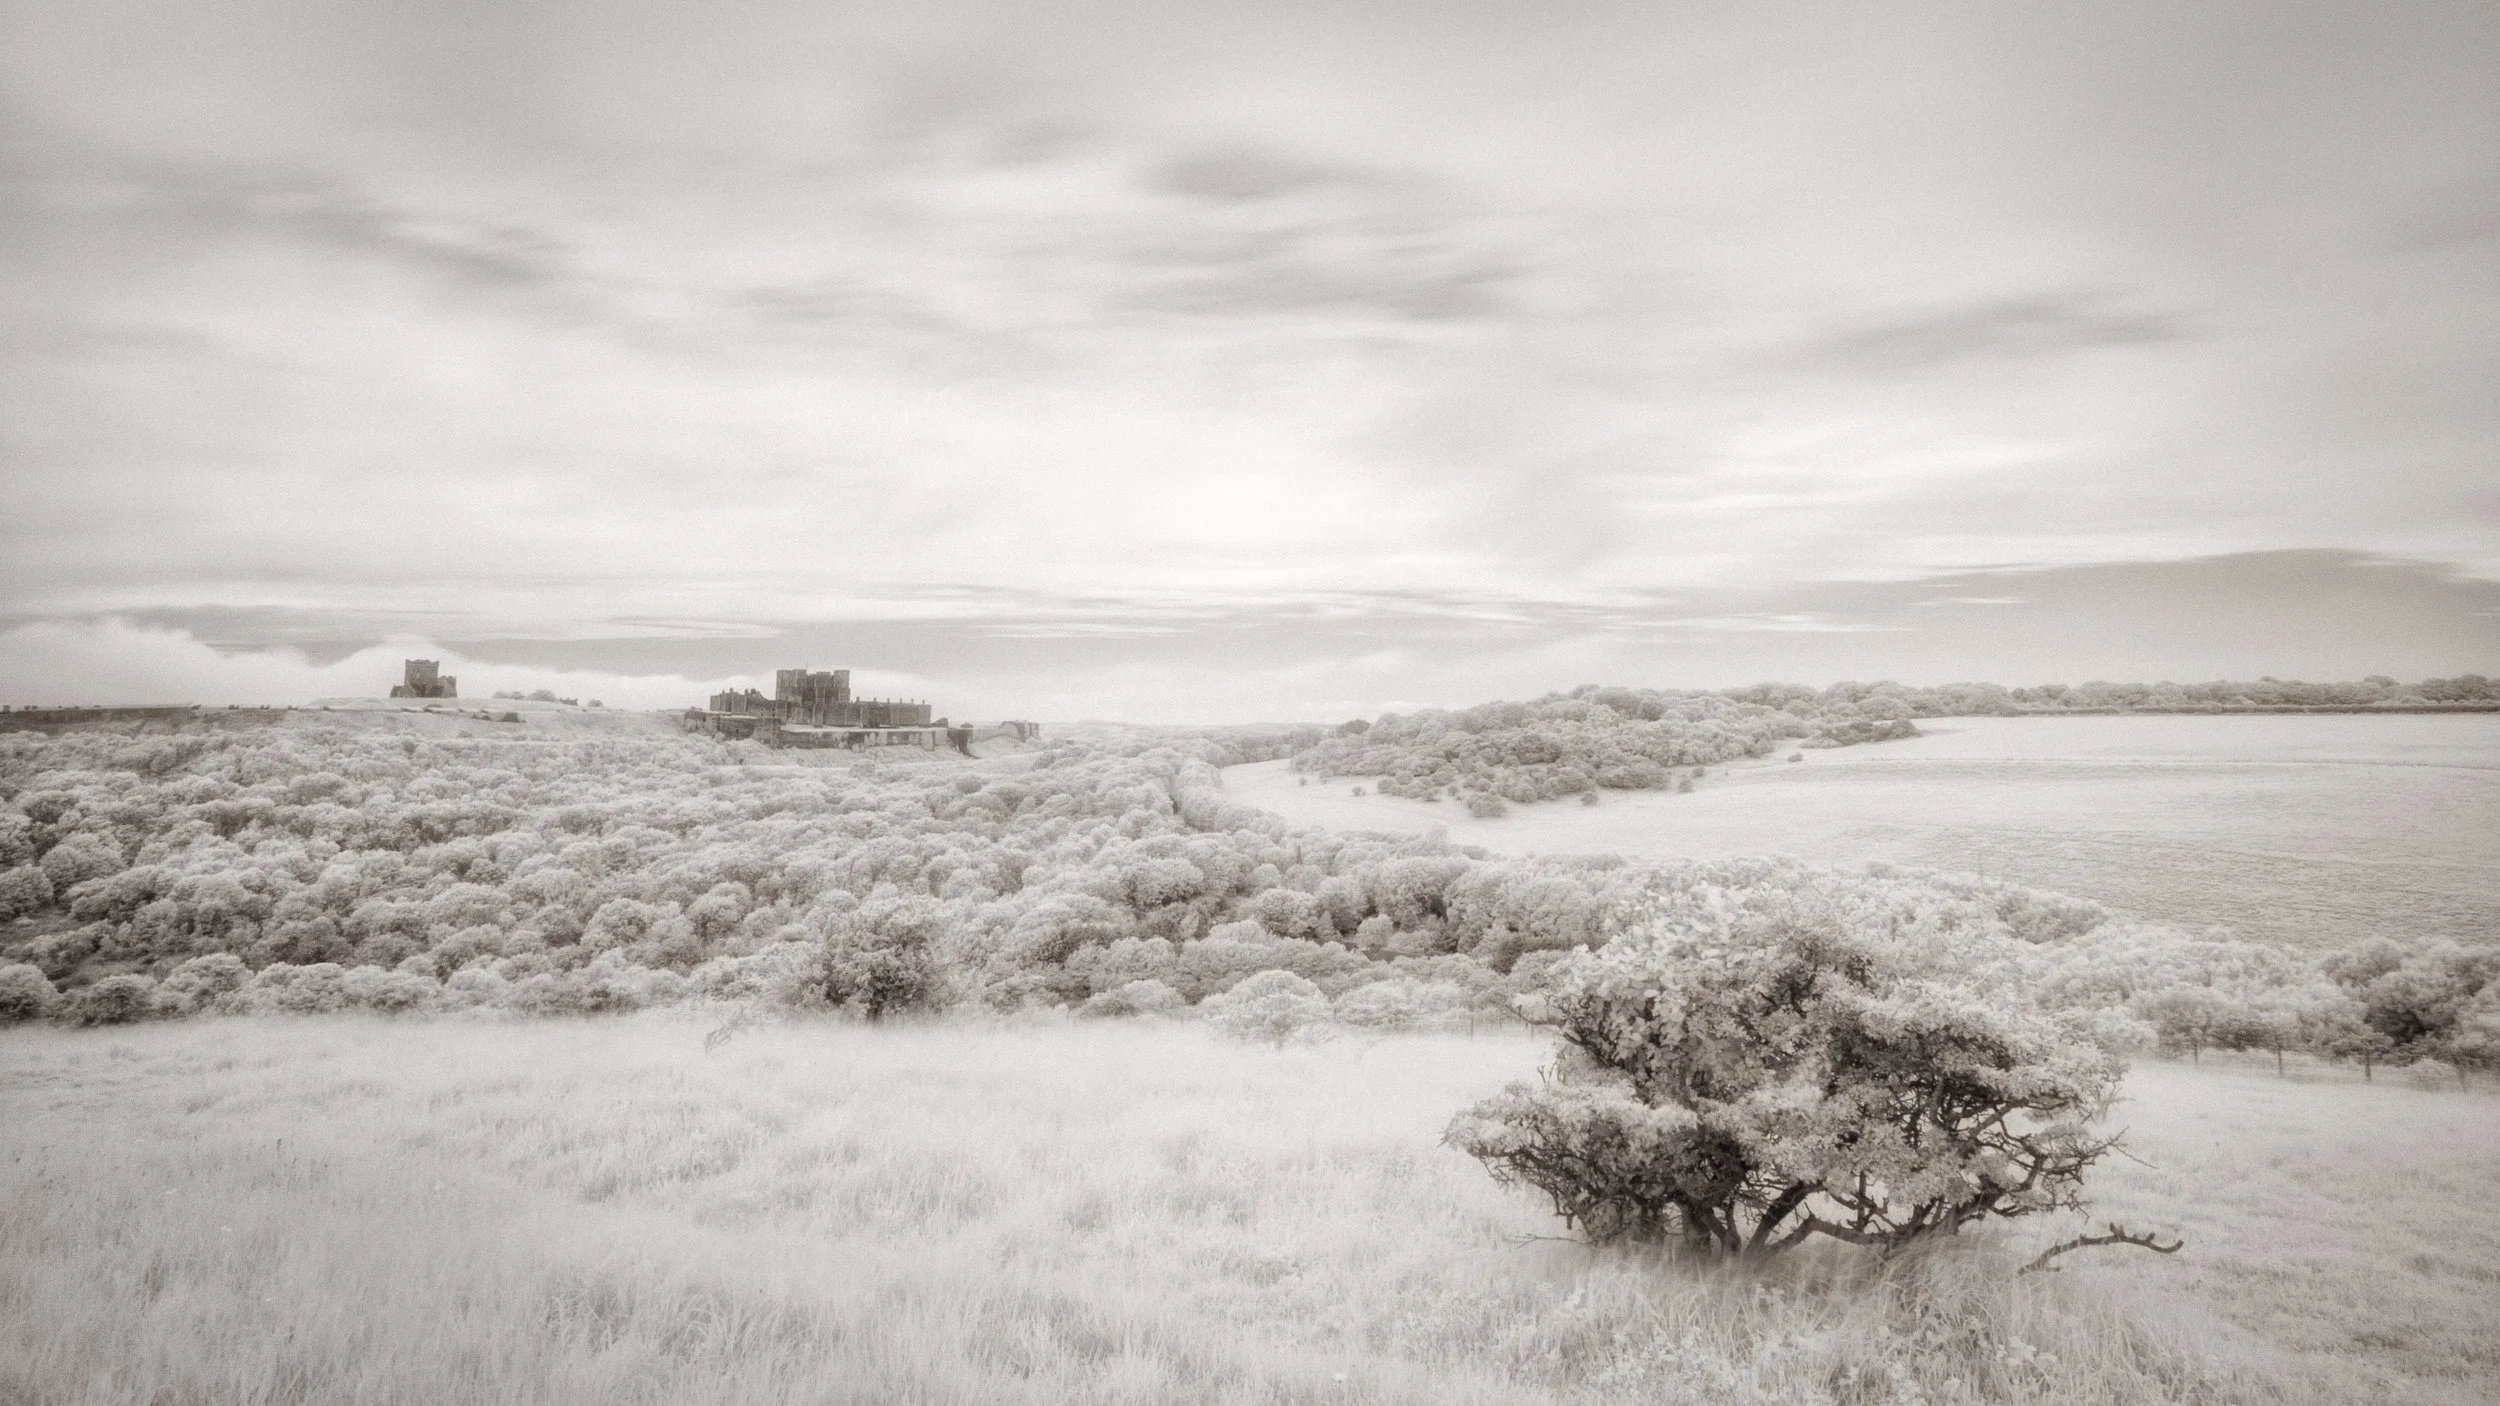
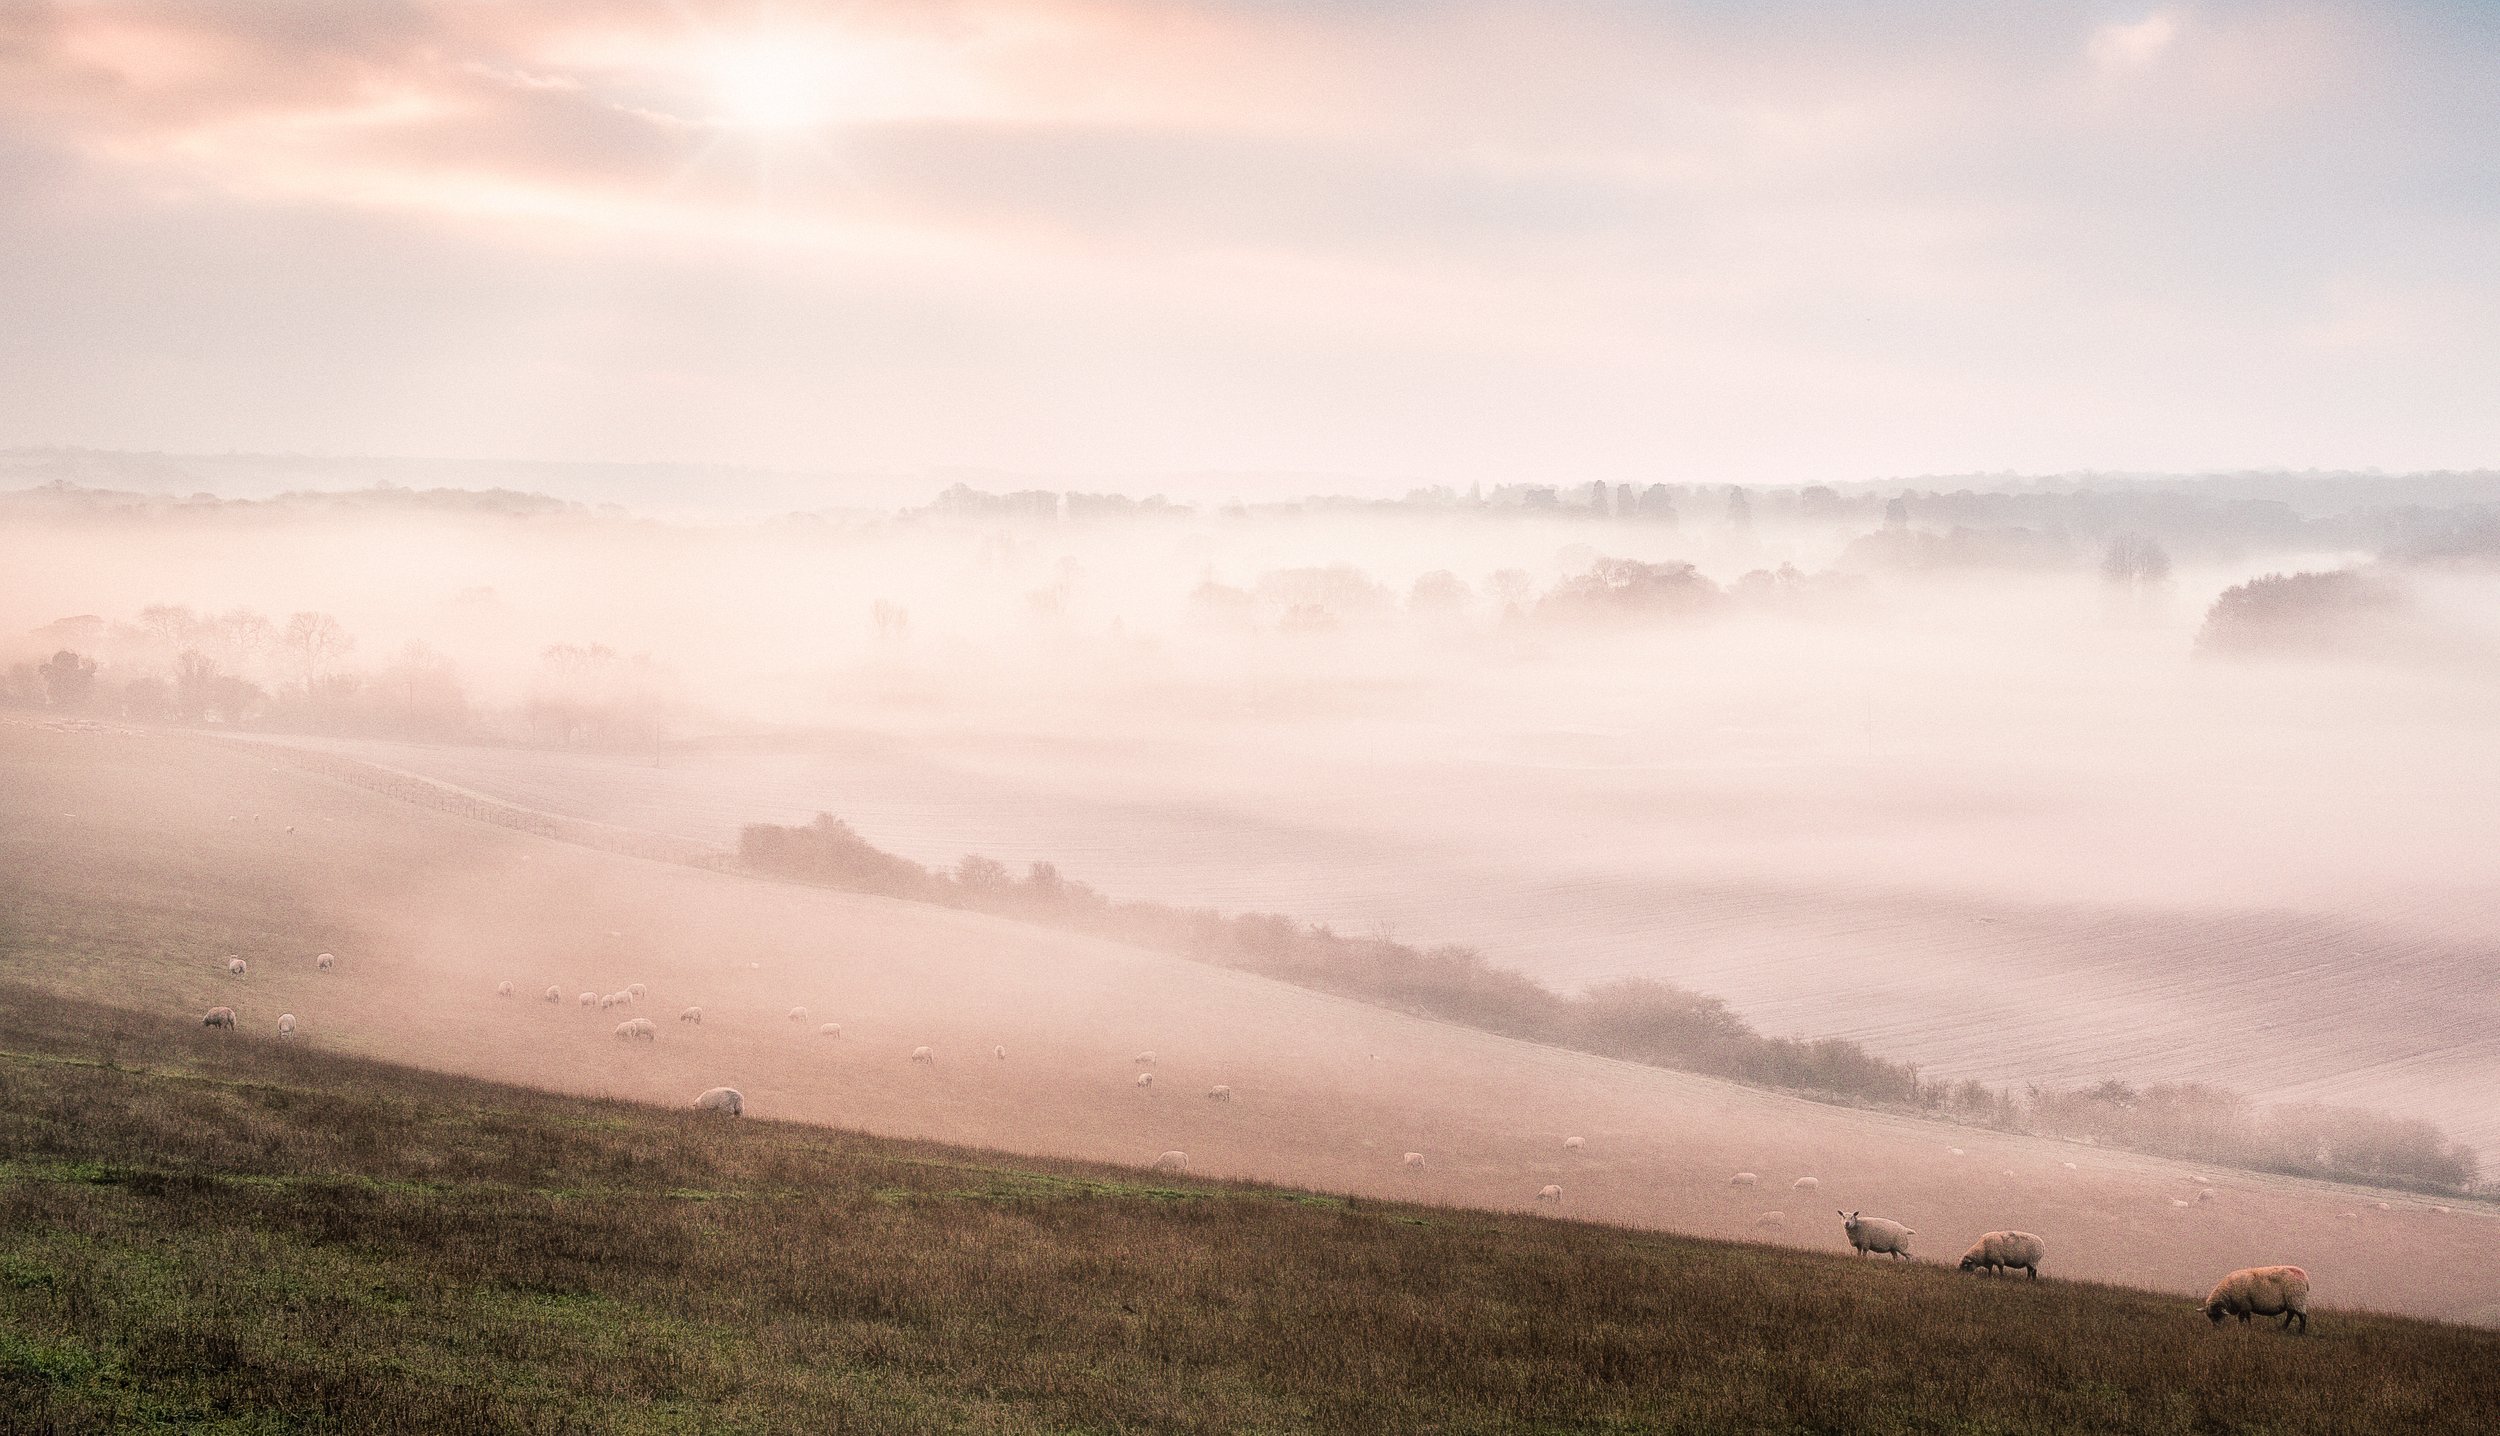


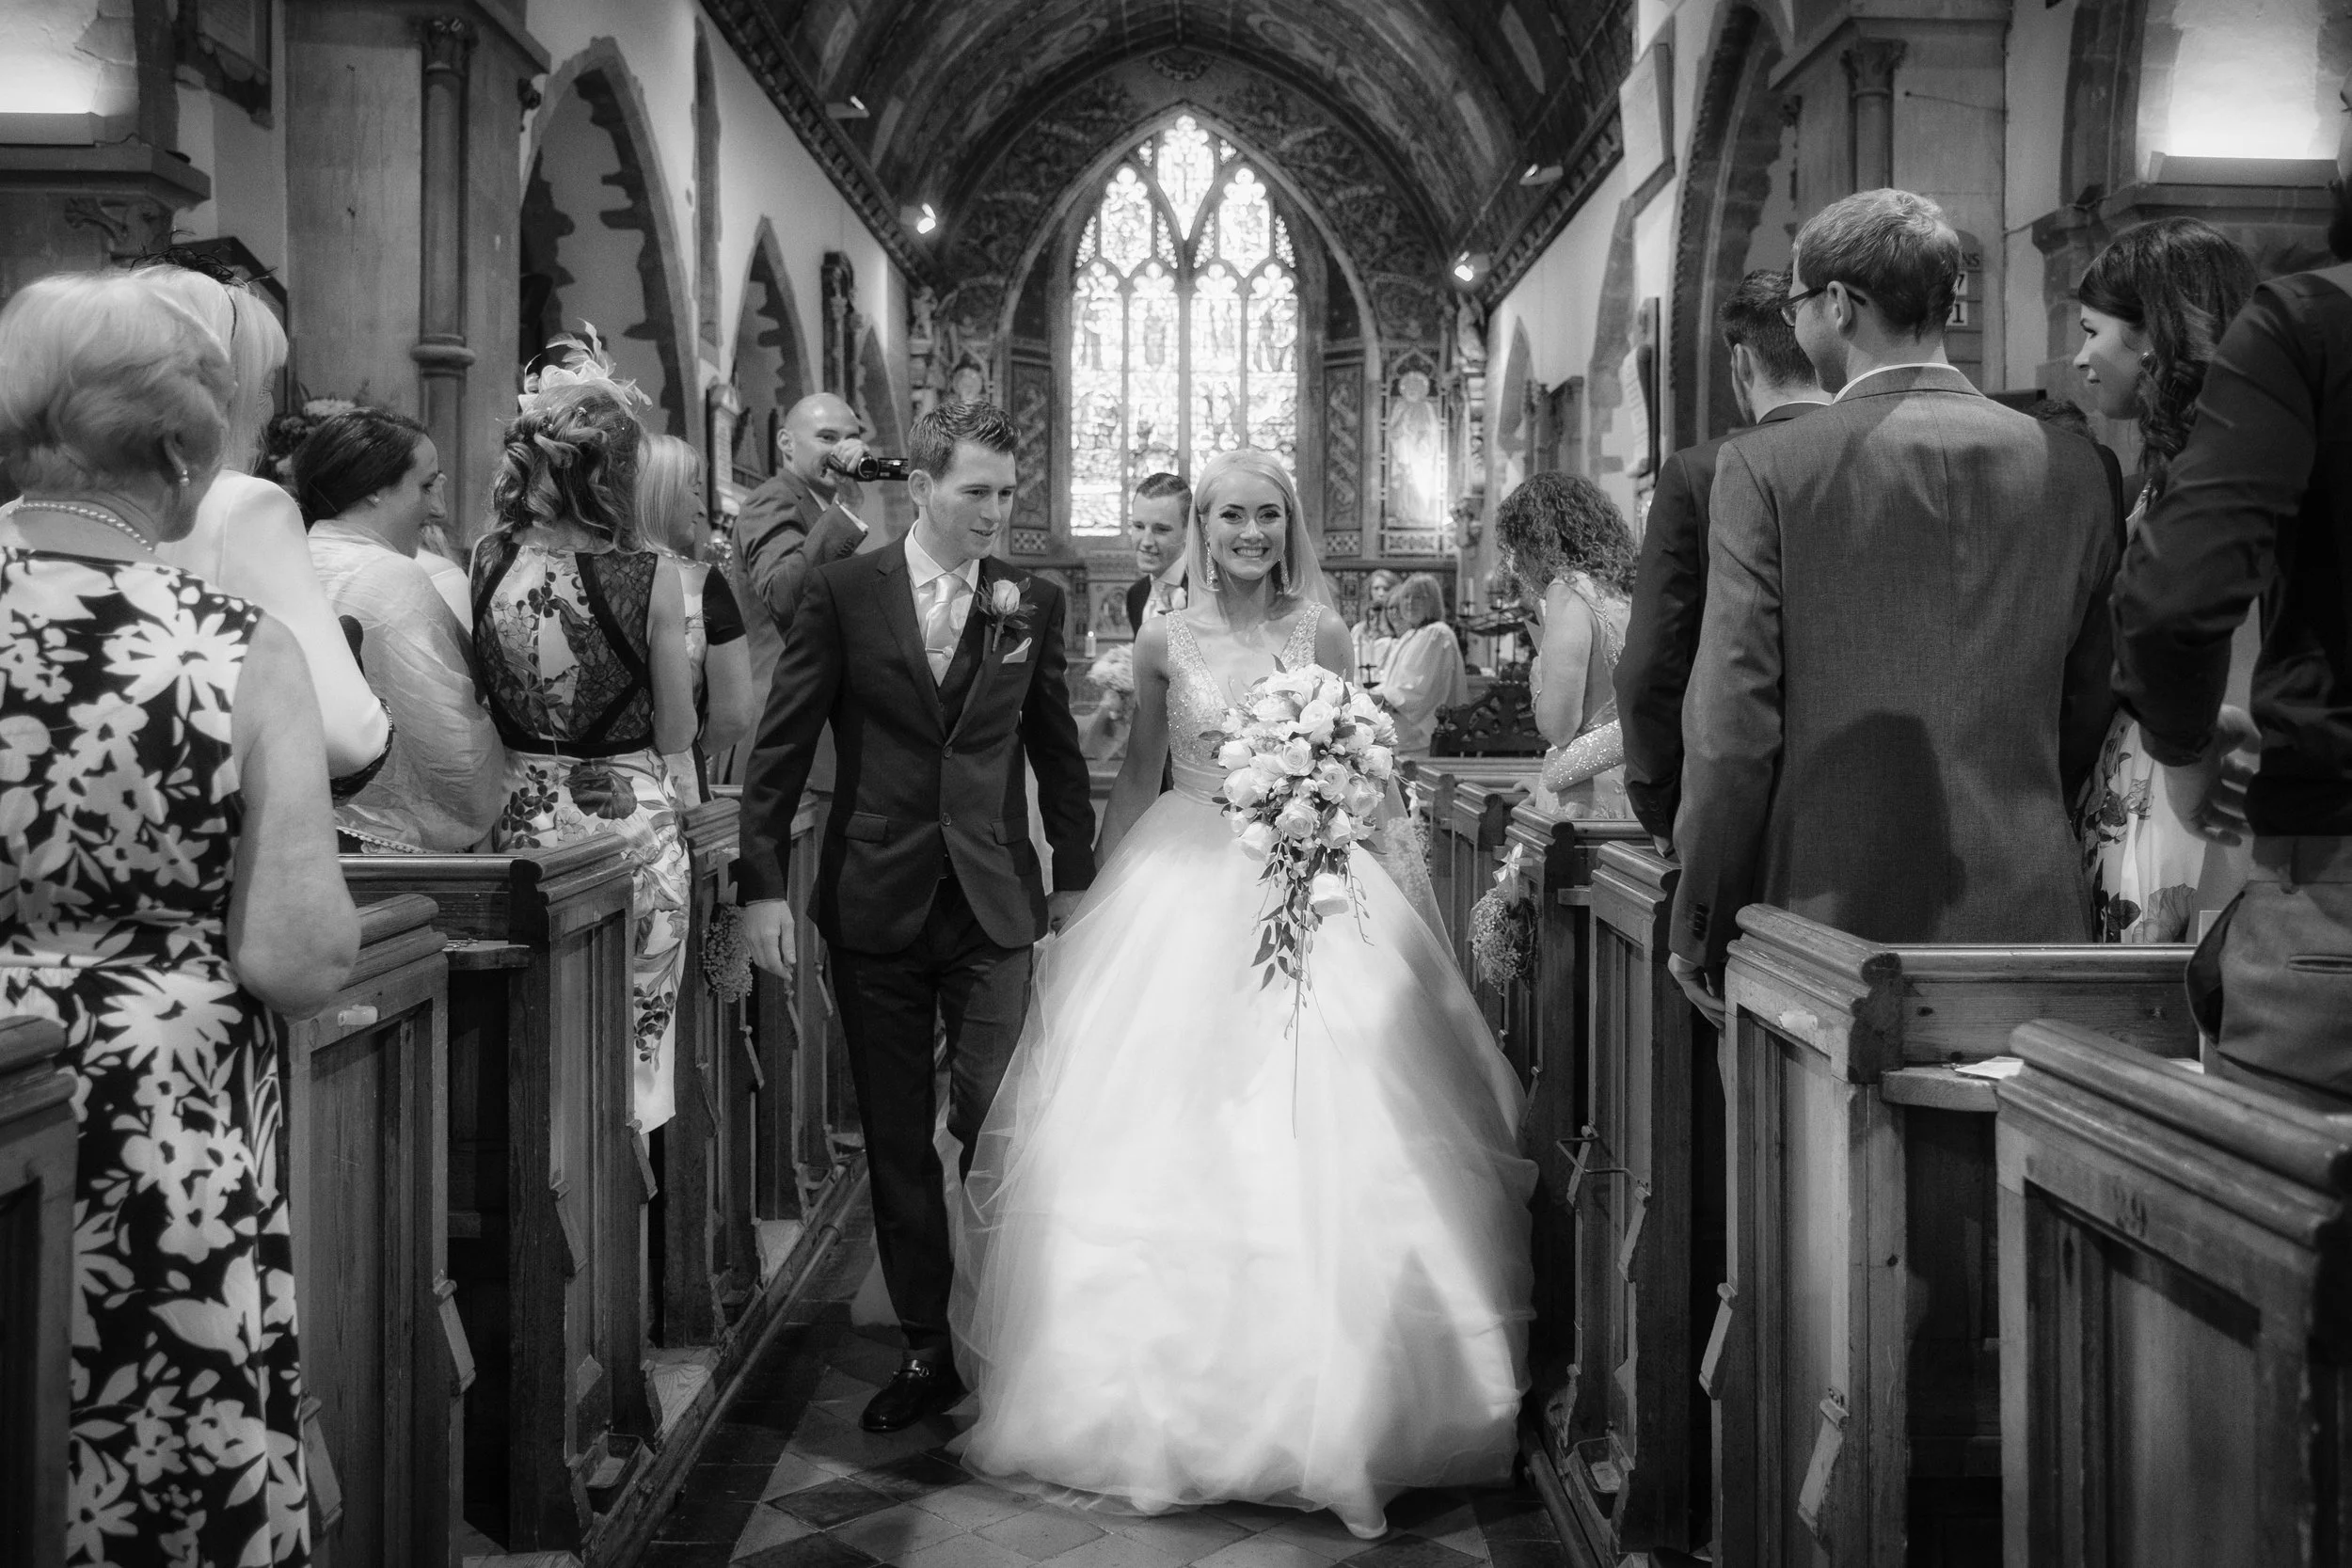
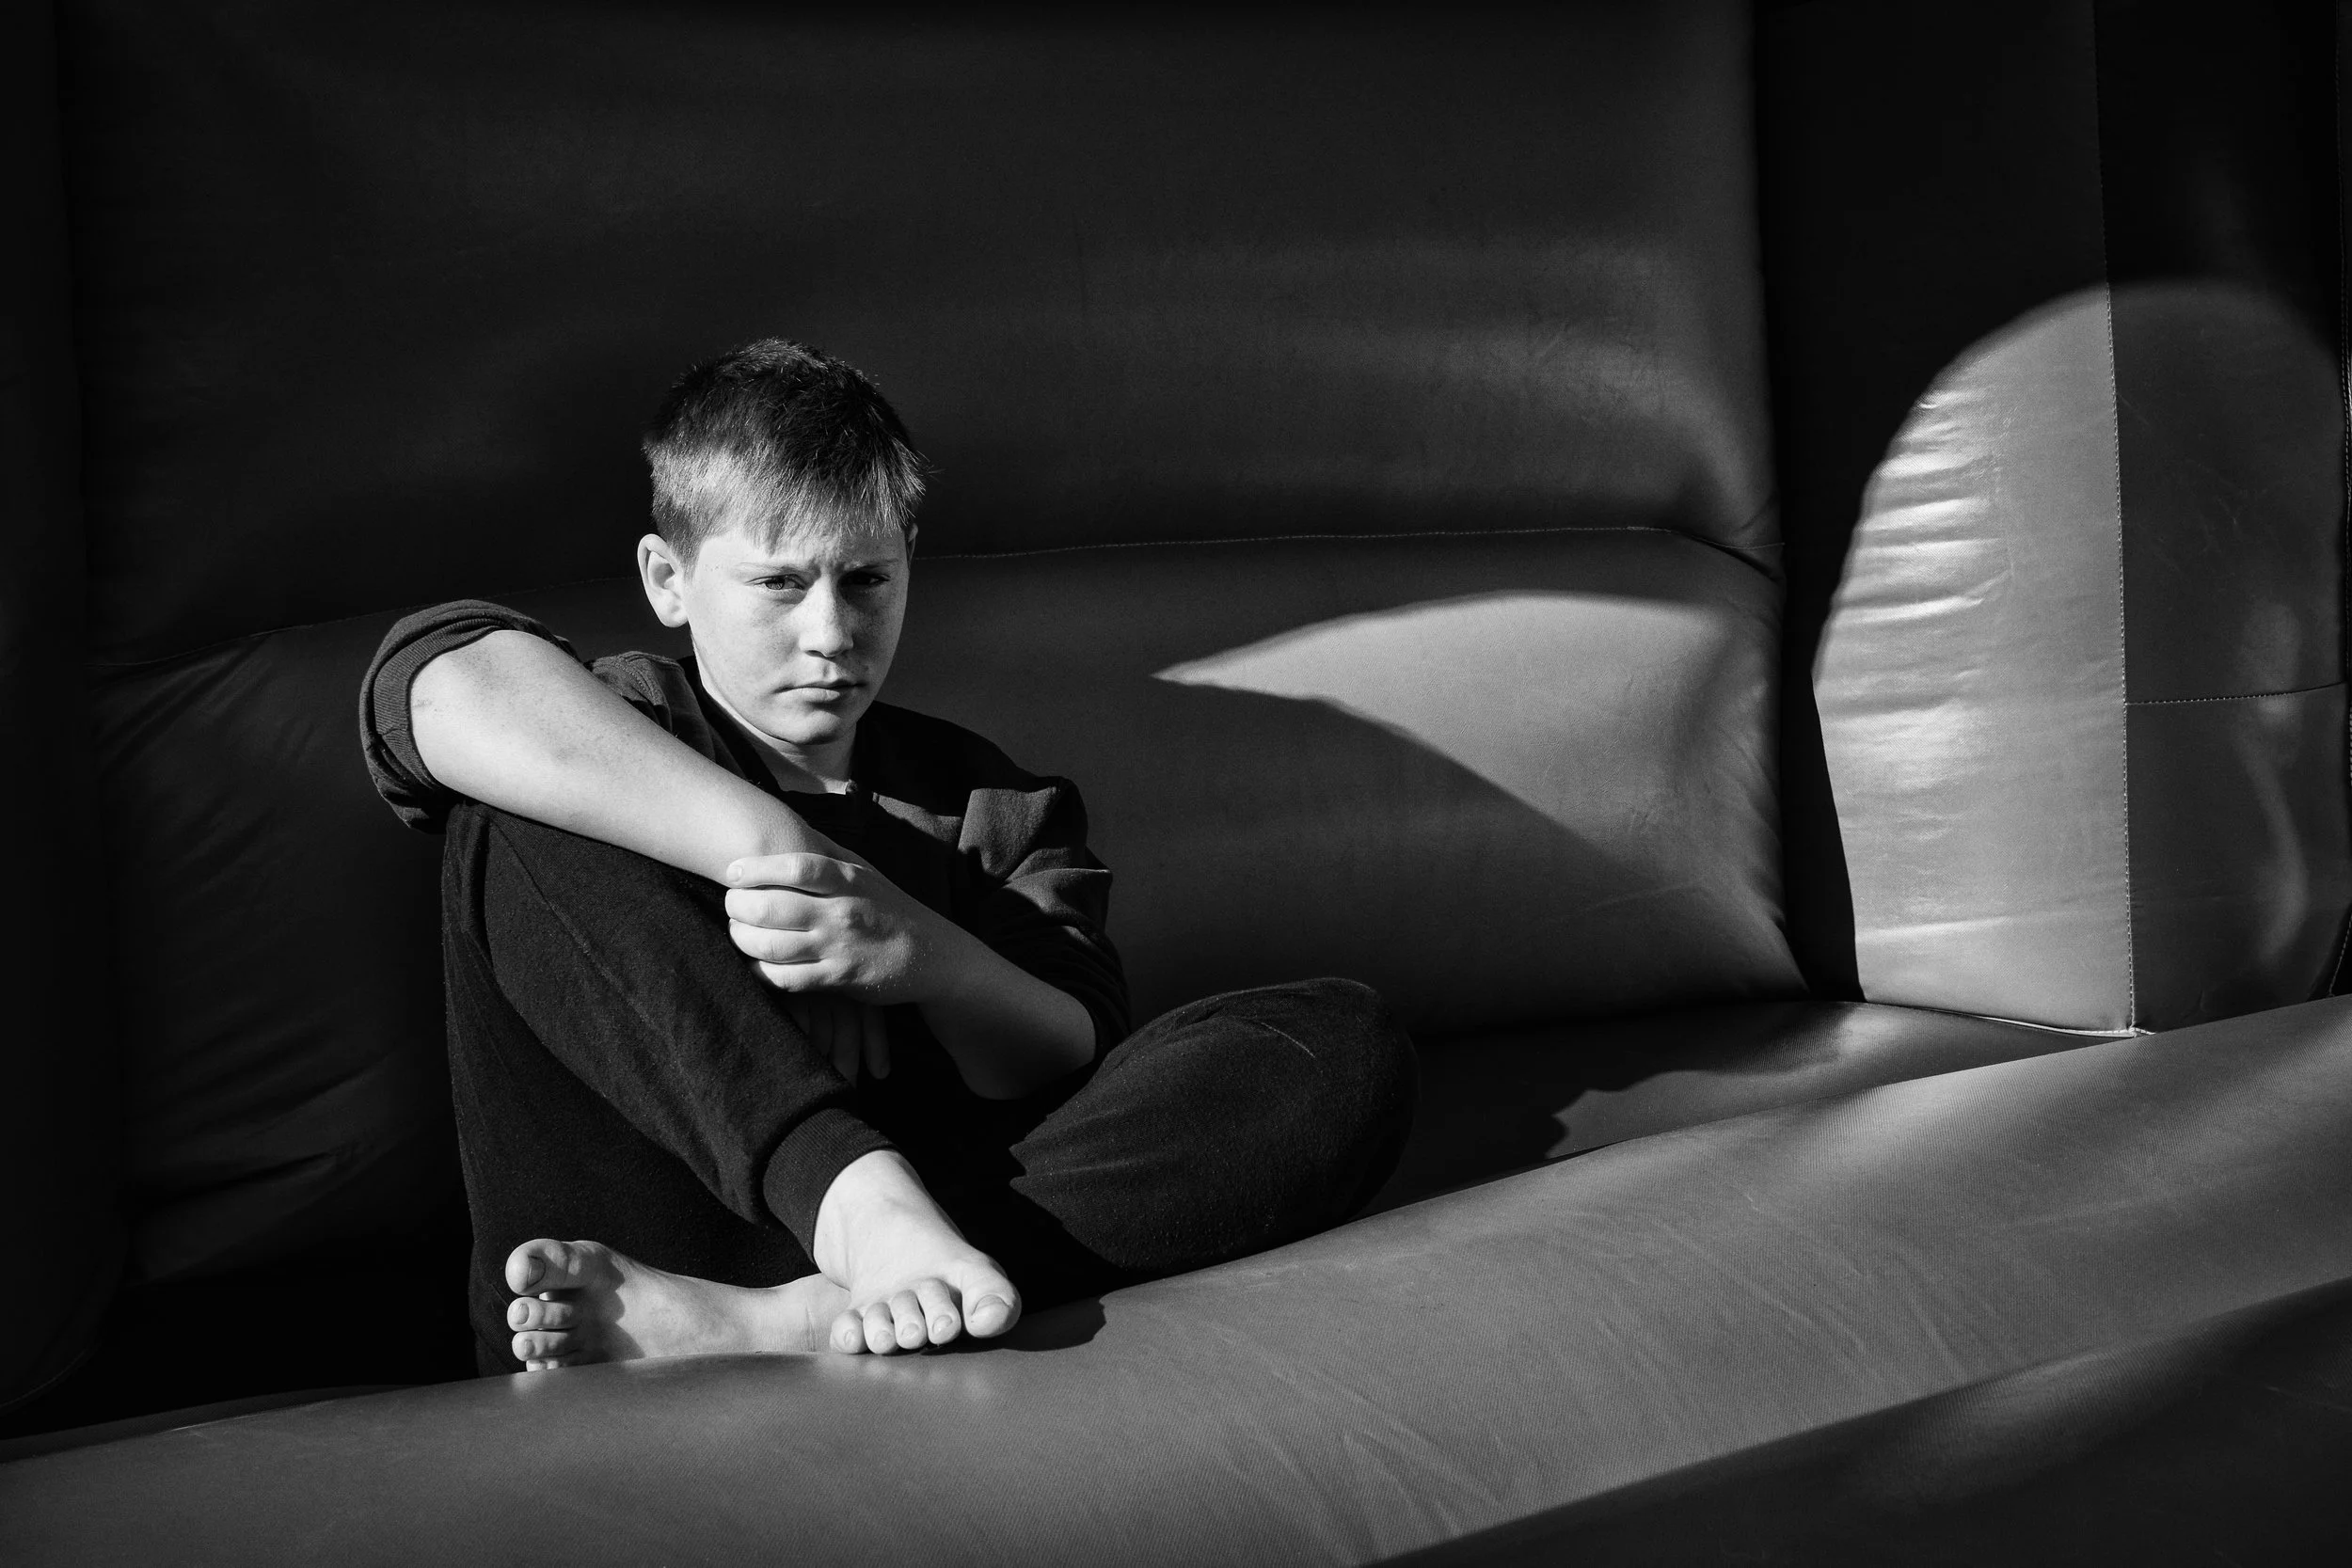














How Camera Metering Uses 18% Grey
Understanding the Zone System makes the mechanics of camera metering easy to describe precisely.
A camera's reflected-light meter measures the light bouncing back from the scene toward the lens. It does not — cannot — know what is in the scene, what reflectance the surfaces have, or whether the scene is lit by bright sun or dim cloud. It takes in a luminance value and calculates the exposure that would render that luminance as Zone V: 18% grey (or thereabouts, depending on calibration). That is its entire job.
This assumption works well for typical scenes — a mixed landscape with light sky, mid-tone ground, and dark shadow areas; a portrait against a neutral background; an interior with a range of surfaces. Such scenes average out to approximately 18% reflectance, and the camera's metered exposure renders them more or less correctly.
The assumption fails in a specific, predictable, and completely understandable set of situations: when the scene average is not 18% reflectance.
Snow and White Subjects
A snow-covered field reflects approximately 80–90% of incident light. The camera, programmed to render that luminance as Zone V, drastically underexposes — it reduces the exposure until the snow reads as middle grey. Snow goes grey. White walls go grey. White wedding dresses go grey.
The correction: positive exposure compensation. How much depends on the scene — typically +1 to +2 stops for a predominantly white field, less if there are significant darker elements in the frame. The mental model: you are pushing the white back up the zone scale to where it belongs. The camera wants to put it at Zone V; you are pushing it to Zone VII or Zone VIII, where a bright-but-textured white should sit.
Dark Subjects and Low-Key Scenes
A black cat. A dark stage. A coal seam. A night scene with predominantly dark surfaces. The camera, receiving a low luminance value, overexposes — it increases exposure until the dark subject reads as middle grey. The black cat goes grey. Shadow detail that should be dark and moody becomes flat and murky.
The correction: negative exposure compensation, or manual exposure set below the meter reading. You are preventing the camera from lifting your dark tones to Zone V and letting them stay where they belong.
Backlit Subjects
A person standing in front of a bright window is the classic example, and it catches people out daily. The camera reads the bright window behind the subject, averages down to Zone V for the whole frame, and underexposes the subject. The window looks reasonable; the face goes dark.
There are several solutions, depending on your equipment and the situation:
Tap to meter (smartphones): tap on the subject's face. The phone will lock exposure to that area and expose the face correctly, at the expense of the background blowing out.
Spot metering: use spot metering mode and meter from the subject's face rather than the whole scene.
Positive EV compensation: if you cannot repoint the meter, apply positive compensation to lift the subject out of the underexposed middle — though this may clip the background.
Fill flash or reflector: fill the shadow side of the subject with supplementary light, reducing the contrast ratio between subject and background so the meter's average reading produces a usable result.
Specular Highlights
A scene with a patch of bright sunlight on water, on glass, on polished metal — specular highlights are not the same as white surfaces. They are direct reflections of the light source, and their luminance is vastly higher than any diffuse reflection. A single patch of specular highlight in the frame will pull the meter reading dramatically toward the bright end, underexposing everything else in the scene.
The solution: spot-meter away from the specular highlight, pointing at a mid-tone area of the scene, or apply positive EV compensation to bring the surrounding scene back up. Accept that the specular highlight itself will be a white point — it should be.
The Grey Card in Practice
A grey card is, conceptually, a portable Zone V. Its value is that it has a known reflectance — you are not guessing at what the scene averages to, or hoping the camera's assumption is correct. You are providing it with a direct reference.
For exposure: place the grey card in the same light as the subject. Point the camera at the card and fill the frame with it. Take a meter reading or set a manual exposure from that reading. Lock that exposure and remove the card. Shoot the subject. This works in any lighting condition and is independent of the subject's own reflectance — whether you are photographing a black cat or a white rabbit, the grey card reading gives you a correct base exposure for that light.
For white balance: most cameras allow you to set a custom white balance from a neutral reference. Photograph the grey card (or the white side of the card) under the light source, and tell the camera to set white balance from that image. This removes the colour cast from tungsten bulbs, fluorescent tubes, overcast sky, or any mixed source. In a RAW workflow, you can bring the grey card image into Lightroom and use the white balance eyedropper to click on the card — the white balance is set automatically and can be applied to the whole session with a single synchronise command.
Modern alternatives: products like the X-Rite ColorChecker Passport and the Datacolor SpyderX Capture Pro combine grey and colour calibration in one tool, with software that generates a custom colour profile for your specific camera under specific lighting. These go beyond the scope of this article but are worth knowing about if you work in controlled conditions where colour accuracy is critical — product photography, commercial work, studio portraiture.
For smartphone photographers: practically speaking, a grey card is not a routine necessity. Modern smartphones compute their exposure and white balance from sophisticated multi-frame analysis, and RAW files from current phones have enough latitude for correction in post. But understanding what the grey card represents — a Zone V reference, independent of subject reflectance — is precisely the knowledge that explains what the phone's camera is trying to do, and why it succeeds or fails in specific conditions. When the exposure goes wrong on a smartphone, it is going wrong for the same reason it goes wrong on any other camera: the scene average is not 18% grey.
Incident Metering
There is a more direct solution to the reflectance problem, and it predates the grey card: the incident light meter.
An incident meter is held at the subject position, pointing toward the camera, with its dome or disc aimed at the light source. It measures the light falling on the subject rather than the light reflected from it. This is a categorically different measurement. A white wall and a black wall, identically lit, will give identical incident meter readings — because the same light is falling on both. The subject's reflectance is irrelevant to the measurement. The incident reading tells you what the exposure should be for that quantity of light; what tone the subject comes out at is determined by the subject itself, not by the meter.
Professional portrait photographers and studio photographers frequently use incident meters for this reason: they bypass the scene-average assumption entirely and give a direct exposure measurement from the light. For controlled lighting in a studio or on location with known light placement, an incident reading from the subject position is the most reliable starting point for exposure. Sekonic and Gossen are the dominant manufacturers of professional handheld meters.
Famous Photographers Who Understood This
Ansel Adams is the central figure already, but one example is worth dwelling on.
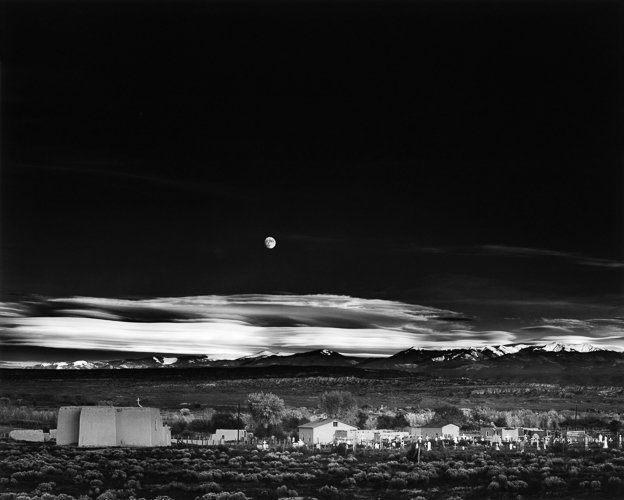
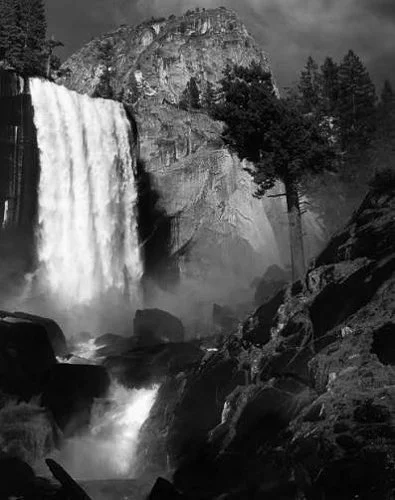
In November 1941, Adams was driving south along a highway in New Mexico when he saw the scene that would become Moonrise, Hernandez, New Mexico — the last afternoon sun illuminating white crosses in a church cemetery while the moon rose against a darkening sky above snowy peaks. He pulled over. He could not find his exposure meter.
What happened next is a direct illustration of the Zone System internalised to the point of reflex. Adams recalled that the luminance of the moon was approximately 250 candles per square foot. He used the Exposure Formula — a calculation from sensitometry — to place the moon's luminance on Zone VII, a bright-but-detailed highlight, and derived the rest of the exposure from there. By the time he had set up the camera and made one exposure on an 8×10 negative, the sunlight had left the crosses. The photograph exists because of one exposure, made without a meter, from a mental Zone System calculation.
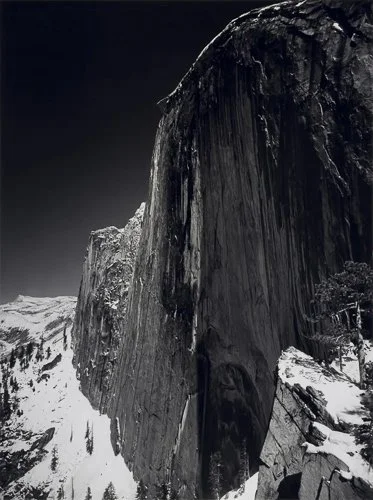
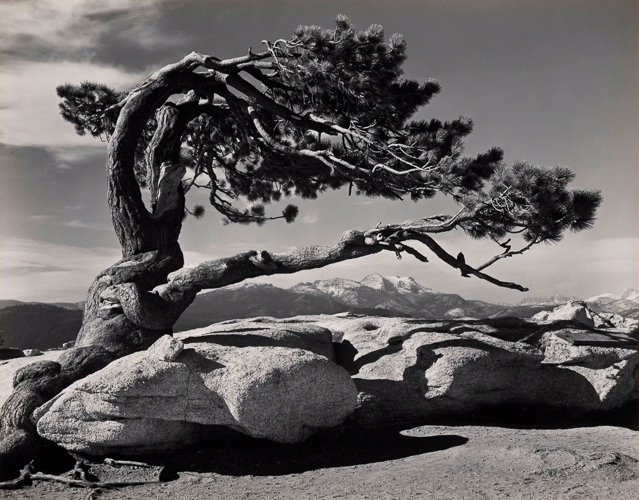
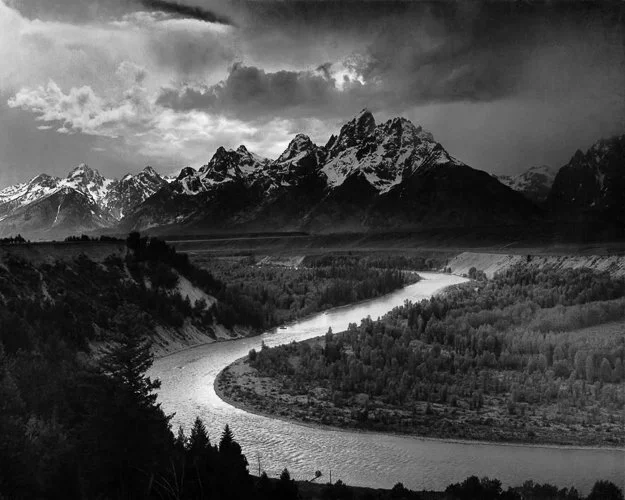
His understanding of tonal placement was not a technique he applied to photographs. It was a way of seeing — the habit, on encountering any scene, of assigning every significant tone to a zone before the shutter was released. Pre-visualisation, he called it: seeing the finished print in the mind before the exposure was made.
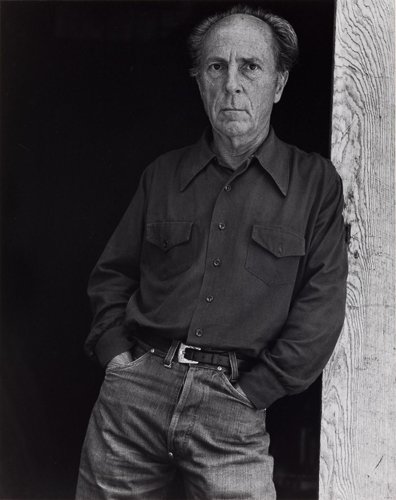
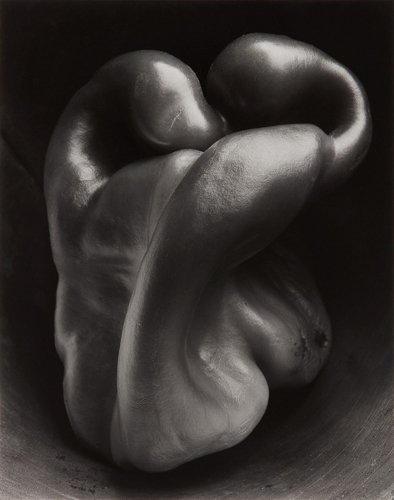


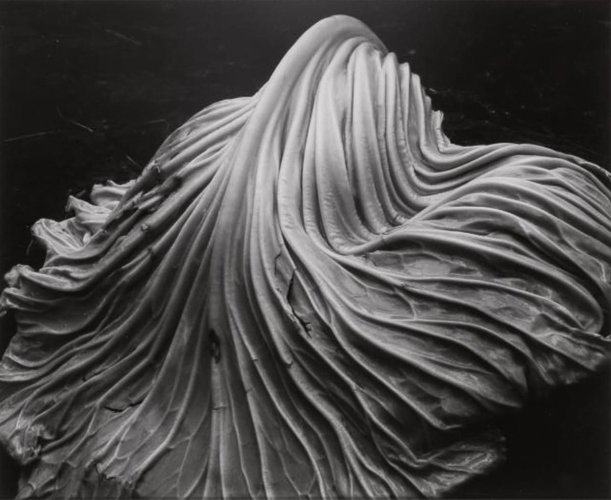
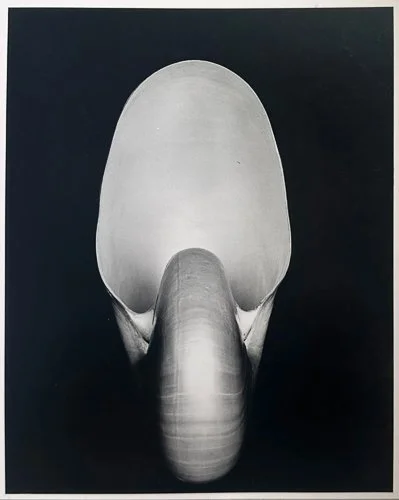





Edward Weston did not systematise his approach the way Adams did, but his contact prints from 8×10 negatives show tonal precision that is entirely consistent with Zone System thinking, arrived at through intuition and practice rather than formal codification. His pepper photographs, his shells, his nudes — the tonal range in these images is not the result of computational correction. It is the result of meticulous exposure of the negative, with shadow detail and highlight separation placed deliberately at the time of capture. Weston understood, without diagrams, that the relationship between negative exposure and print tone was something the photographer controlled — not something that happened automatically.
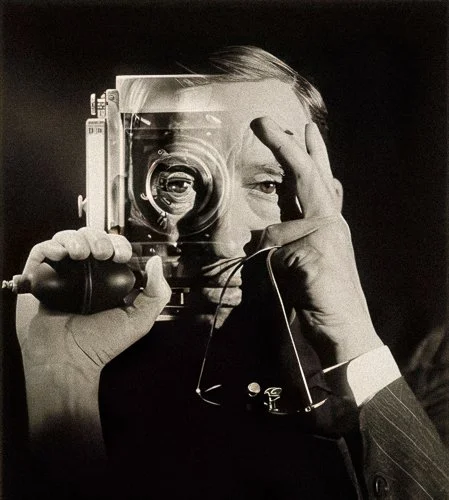
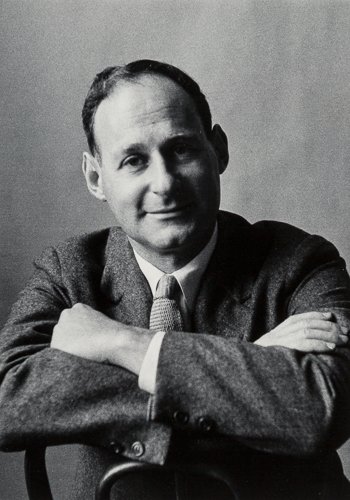
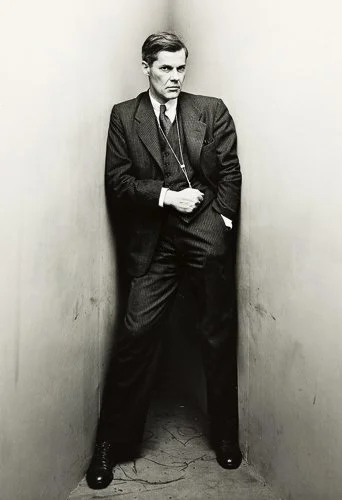
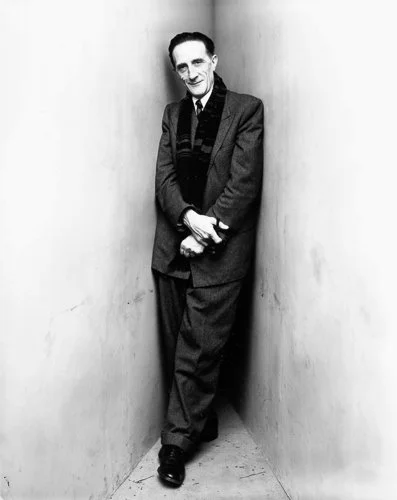
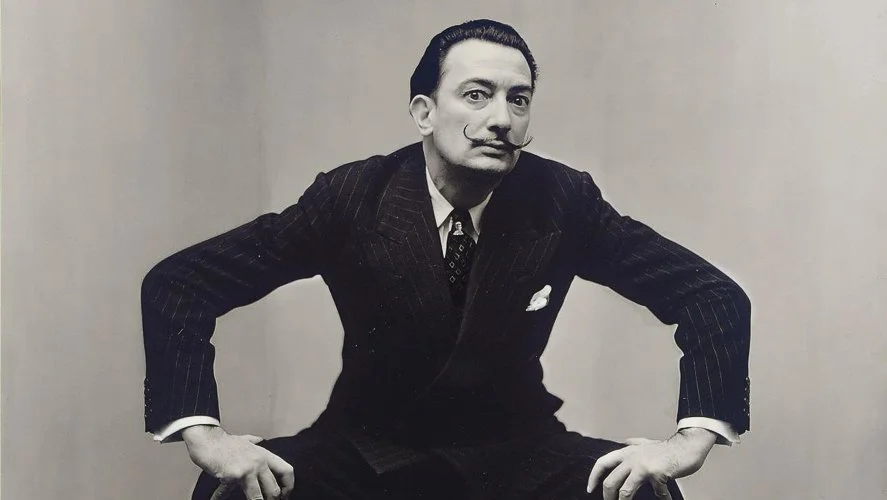
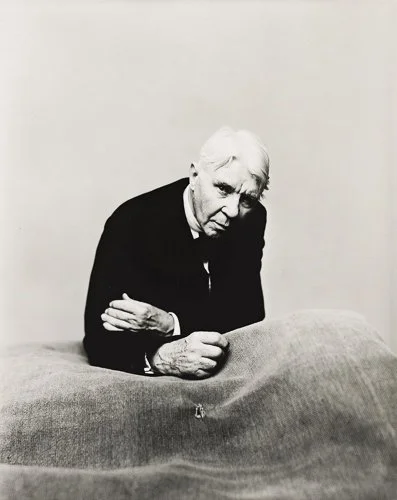
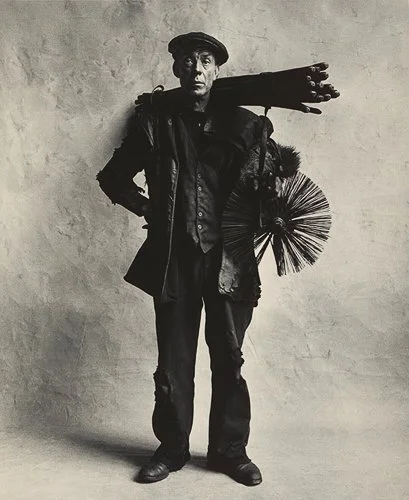
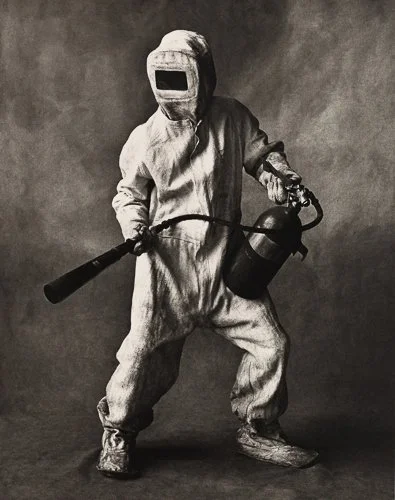
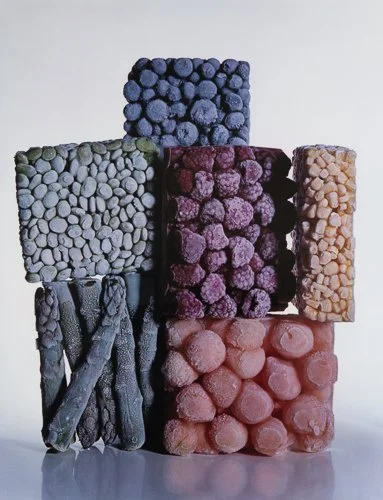
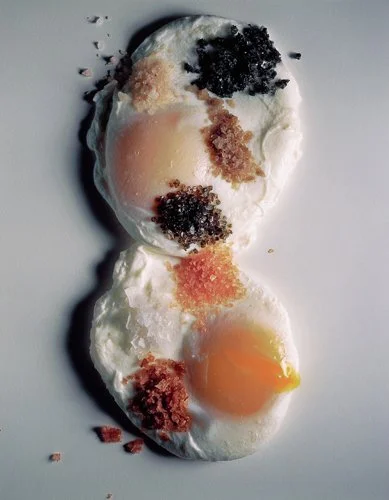
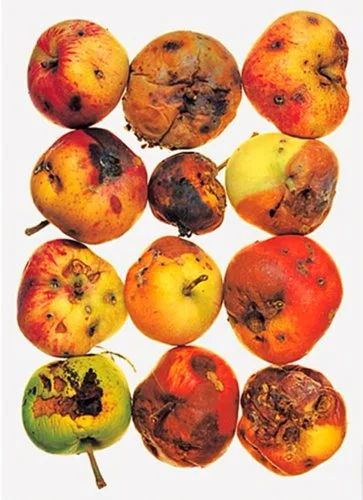
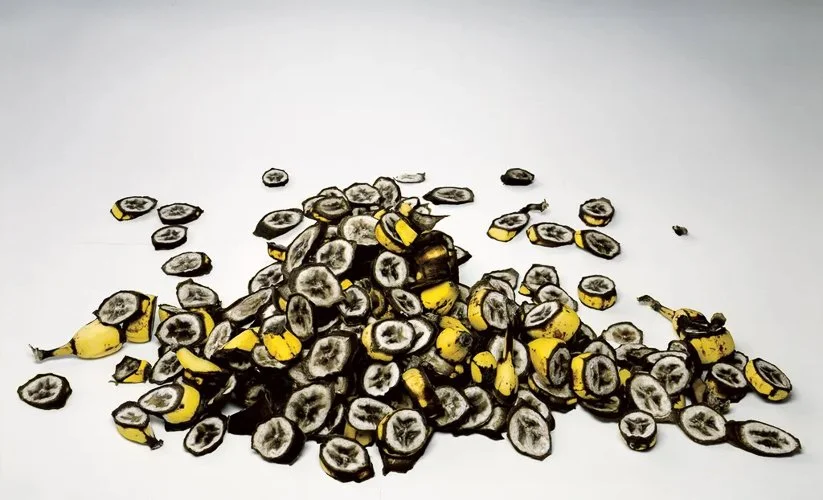
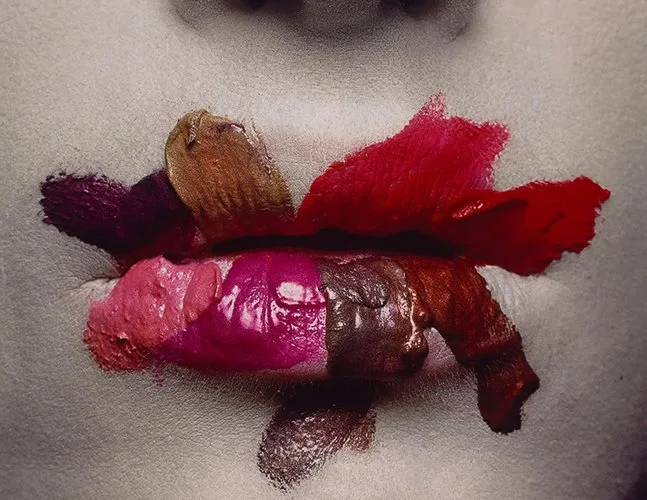
Irving Penn’s studio work — his still lifes, his portraits of tradespeople, his series on cigarette ends, his studies of tribal peoples made in New Guinea and Peru — is a masterclass in tonal precision. His white backgrounds are white: bright, but with texture visible in the slight gradations of studio illumination. His shadow areas retain detail. His midtones are placed where they belong. This is not the result of post-processing rescue; it is the result of careful incident metering, precise exposure, and an understanding of what the camera can and cannot do with a given tonal range. Penn had no interest in relying on the laboratory — or, later, the darkroom — to correct what should have been correct at the moment of capture.
18% Grey & Computational Photography
Modern smartphones have added a layer of computation between the sensor and the final image that makes the 18% grey principle harder to see — but does not eliminate it.
The process: a modern phone in its default mode captures several frames in rapid succession, at different exposures, and blends them using AI-driven HDR processing. Individual frames are tone-mapped to extend the apparent dynamic range. Real-time image stacking reduces noise. Scene recognition adjusts the processing based on what the AI thinks is in the frame — skin tones are handled differently from skies, which are handled differently from night scenes.
At the sensor level, each of these individual frames is still metered on the same 18% grey principle — the phone's metering system is making exposure decisions based on the scene's luminance average, exactly as described above. The difference is that the final image is the result of computational blending across multiple exposures rather than a single metered capture. The range of recoverable tones is greatly extended.
The practical upshot: smartphones handle typical scenes very well with no photographer intervention. The situations where understanding 18% grey still matters for smartphone shooting are the same edge cases that trip up traditional cameras — predominantly white or dark scenes, strong backlighting, specular highlights.
In those situations, tapping to set the metering point, using the exposure slider that appears after tapping, and/or switching to RAW capture are the tools of choice. The phone is not fundamentally different from a DSLR in its perceptual limitations; it is just better at hiding them.
A note on AI scene recognition: modern flagships increasingly use subject-specific exposure models — not "what is the average luminance of this frame?" but "this frame contains a face, and I know what a correctly-exposed face should look like." These are refinements of the 18% principle, not departures from it.
Rather than assuming all scenes average to Zone V, the phone is making a more sophisticated assessment of what Zone V should mean for this specific scene. The underlying calibration to human visual perception — the logarithmic scale, the perceptual midtone — has not changed.
Resources
Here’s an interesting video from Peter Charles: a concise and practically-oriented explanation of how Zone System thinking applies to digital metering and exposure compensation. It is especially useful for photographers moving from a purely automatic shooting approach toward deliberate tonal control.
Paul Campbell traces the number from Munsell's perceptual research through to photographic practice. Longer and more technical than most photography videos, but genuinely interesting if the history covered in this article has caught your attention. “18% Grey is used throughout video and photography as a reference for nailing exposure. Not many know where it comes from, or exactly why 18%. I take a brief look at the history of human perception of brightness and answer the question: Why 18%?“
Anthony Morganti explains how to utilize an 18% gray card to achieve accurate exposure and consistent white balance in digital photography. The demonstration highlights practical techniques for using this tool in the field and adjusting settings during post-processing to ensure optimal image quality across varying lighting conditions.
Here’s the one and only Ted Forbes of The Art of Photography with an excellent video on Ansel Adams and his development of the Zone System: “In this video I'm going to talk about the work of Ansel Adams, one of the most successful photographers of all time. He is largely responsible for starting the "California School" of photographers along with Imogen Cunningham and Edward Weston. Their Group f/64 rejected the Pictorialism styles of the day in favor of "pure" or "straight photography". Ansel developed printing techniques that yielded beautiful prints with an emphasis on tonality and sharpness. Along with Fred Archer, the two developed what we know today as the Zone System — a formalized process for black and white printing. It divides the picture into measured zone densities allowing the photographer to control the exposure in camera, negative processing and the final print.”
Give it a Try!
Exercise 1: The Grey Card Experiment
Obtain an 18% grey card. Kodak, Lastolite, and most professional photography suppliers stock calibrated grey cards; a decent-quality one costs a few pounds and is a useful long-term tool. If you do not have one immediately to hand, a mid-grey painted wall or a grey piece of smooth card will do as an approximation for this exercise (though an uncalibrated surface will affect the precision of what you observe).
In a room with a fixed artificial light — a reading lamp at a consistent distance — photograph three subjects in succession: the grey card, a sheet of white paper, and a piece of dark fabric (black or very dark grey). For each, let the camera auto-expose. Do not use any exposure compensation; let the camera decide.
Review the three images. You should find that the grey card, the white paper, and the dark fabric have all been rendered at a similar tone — approximately middle grey. The camera has attempted to make each one Zone V.
Now switch to manual exposure. Meter from the grey card — fill the frame with it, take the reading, and lock that exposure setting. Without changing the exposure, photograph all three subjects again.
Now the white paper will look white, and the dark fabric will look dark. The grey card will look grey. You have seen, directly in your own photographs, what 18% grey metering actually does — and what happens when you override it with a known reference.
Exercise 2: The Correction Challenge
Photograph five scenes in which you know in advance that the camera will misjudge the exposure:
A snow scene, a white-walled room, or any predominantly bright subject
A very dark subject against a dark background
A subject backlit against a window or bright doorway
A scene with a strong patch of specular highlight (sunlight on water, glass, or polished metal)
A deliberately dark, low-key composition — a moody interior, a subject in deep shadow
For each scene, make two exposures: one on auto-exposure with no compensation (let the camera decide), and one with the exposure you judge to be correct — positive EV for the bright scenes, negative EV for the dark ones. Compare the pairs.
The aim of this exercise is not to produce technically perfect photographs. It is to build the habit of predicting where the camera will go wrong before it does — looking at a scene, identifying the metering problem, and making the correction before the shutter fires. After you have done this exercise deliberately half a dozen times, it begins to happen automatically. You glance at a backlit scene and your thumb is already reaching for the exposure compensation dial.
Exercise 3: The Zone V Walk
Go for a thirty-minute walk and find ten subjects that you judge, by eye, to be approximately Zone V — middle grey in tonal value. Examples: weathered concrete, dried grass on a verge, a grey pavement under overcast light, the bark of a silver birch, a blue sky in the upper mid-portion of the frame (not the sun, not white cloud — the clear blue in between). Bark, stone walls, and brown earth tend to be reliable Zone V subjects.
Photograph each one and check the histogram immediately after capture. A correctly metered Zone V subject — one the camera sees as middle grey — should produce a histogram with its main peak close to the midpoint. If the peak is well to the right, the subject is brighter than Zone V and the camera has underexposed. If it is well to the left, the subject is darker than Zone V and the camera has overexposed.
The aim is to calibrate your eye to 18% — to develop the ability to identify, in any scene and without a grey card, which subjects are close to the metering reference point and which will lead the camera astray. This is the skill that Adams had by reflex, and that you can develop by practice.